


Google Analytics is a valuable information tool for virtually any small to medium-sized business.
It tells you a lot about the people who are coming to your website and interacting with the public face of your business.
But it can seem a little complicated at first.
That’s why it’s important to give yourself a little time to understand the basics of how Google Analytics functions, what it can do for you, and how it needs to be set up properly to generate the accurate and relevant data you need it to.
5 Easy Steps to Start in Google Analytics
And Why It’s Important
With Google Analytics, you’re trying to understand how your website is performing, while considering potential opportunities to market your business.
First, it’s important to understand the metrics of who is visiting your site and how the data is being used. This will show you:
- Where the opportunities for improvement are
- Where & how you can get more leads
- How to grow your business
There are five key spots to look at in Google Analytics to get a picture of what’s going on.
One of our team members would be happy to analyze this for you. We can show you where the low-hanging opportunities are for improvement.
Within 10 or 15 minutes, we’re typically able to show clients simple and effective things about what they should be doing and how it can help increase confidence and peace of mind in making informed marketing decisions.
So let’s dive in. Here the five things that are most important.
1. Do You Have Traffic & Where’s It Coming From?
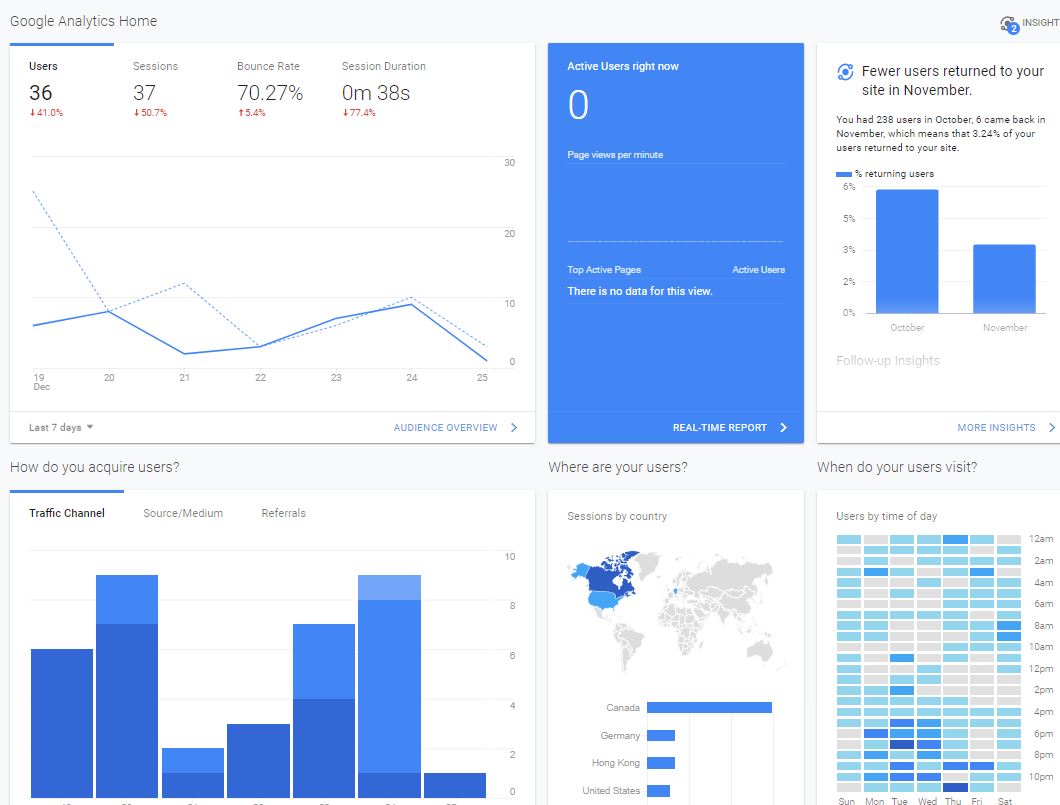
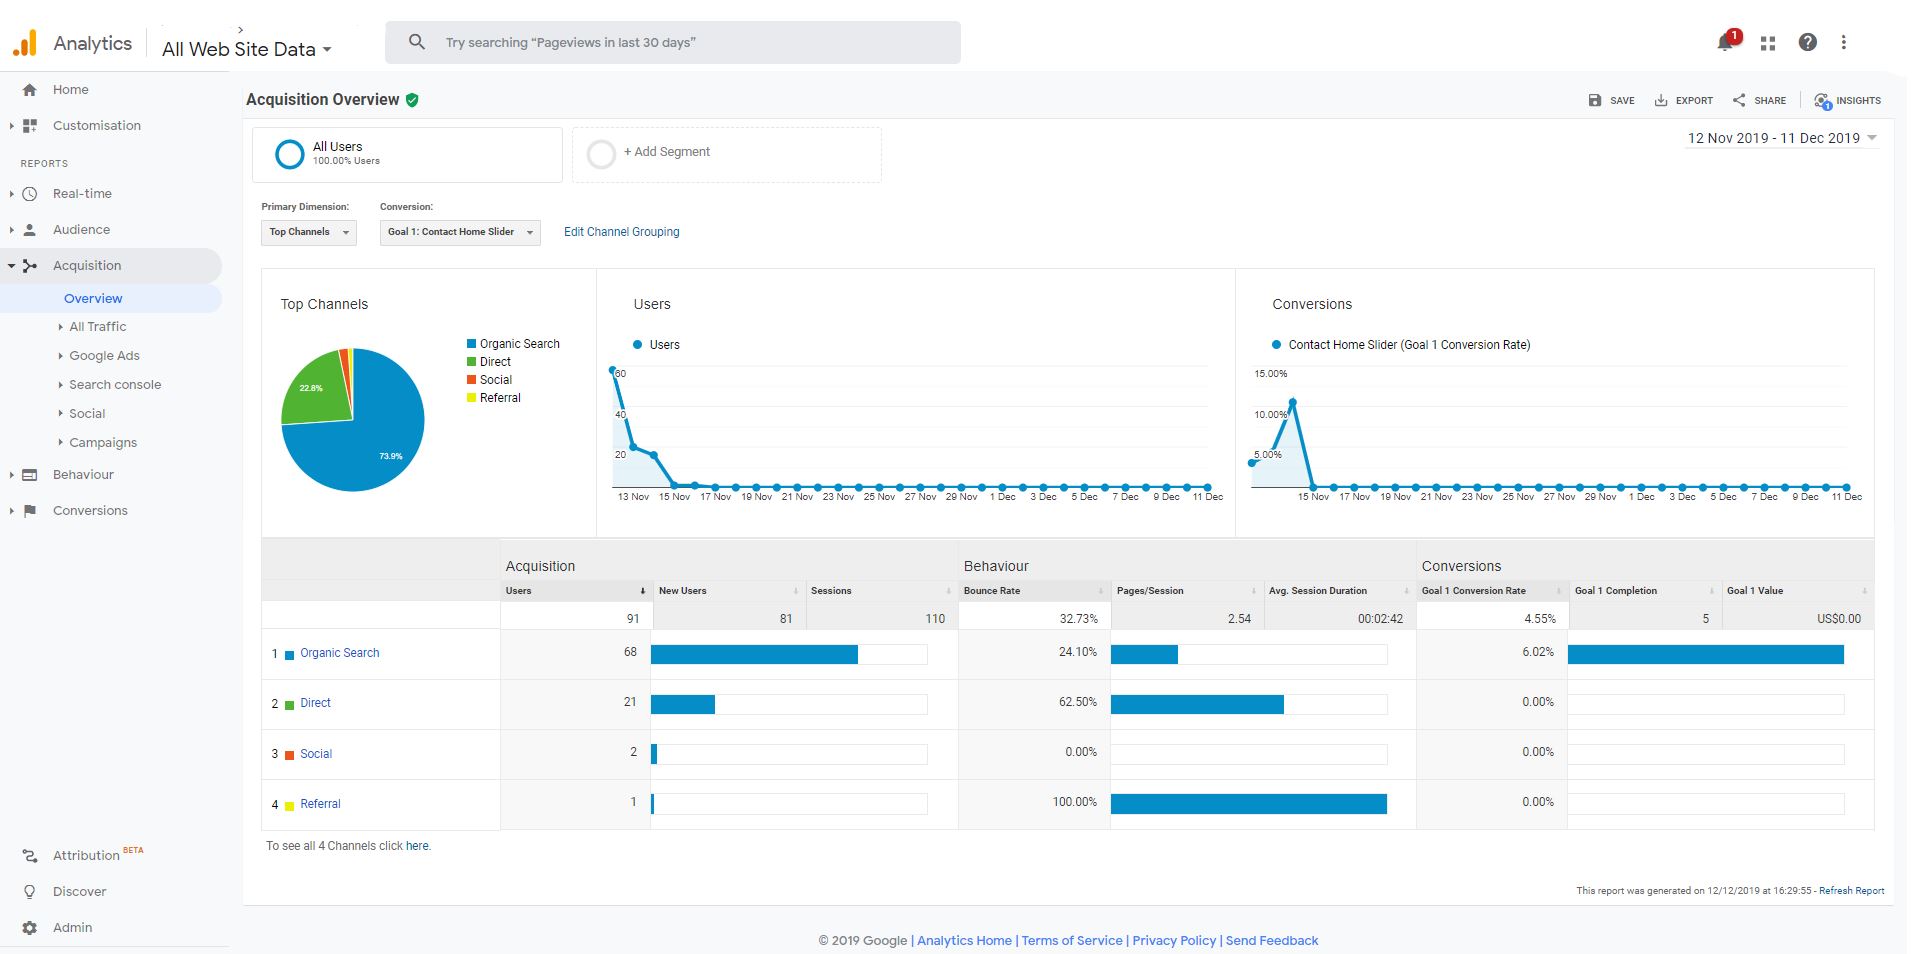
Diving into the Google Analytics platform, the first step for a small business owner is to get a better understanding of how much traffic you’re getting and where it’s coming from.
As we show in the screen shot above, you’ll want to start by going to the left-hand column, where you see a tab called “Acquisition.” Open that, then select “Overview.”
Voila. You’re now looking at a top-level view of your site traffic.
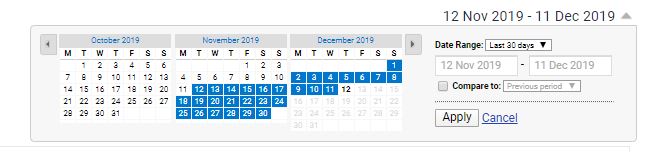
Something helpful at this point is changing the date range to “Last 30 Days.” Analytics usually starts you with a default of 7 days, but the last 30 days gives you a better sample size for averages.
This initial step lets you see:
- How many users have visited your site during this time period
- How many conversions they have taken (more on that next)
- Where the traffic is coming from (Search, Social, etc.)
- How long they’re spending on your site & how many pages they’re viewing
It’s a great overview of how your site is doing in terms of traffic.
2. Are You Tracking Conversions?
In a previous article we talked about why it’s important that you have conversions set up – and set up properly.
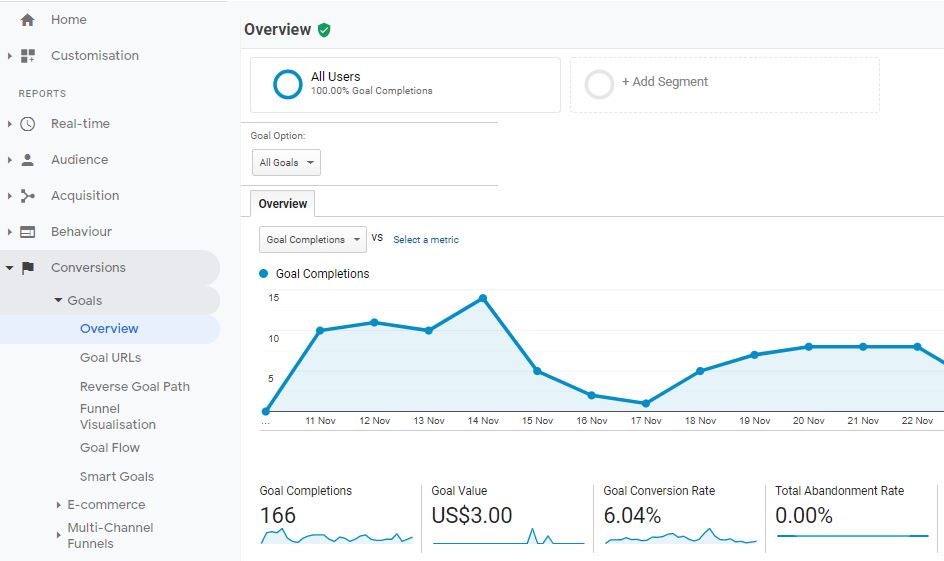
In the left-hand column, select the “Conversions” section, then open “Goals.” (see screenshot above)
This page tells you all about goal completions – which is Google’s term for conversions. It tells you:
- How many goals were completed
- Overall goal conversion rate
- Specific goals completed, e.g.:
- Filled out a contact form
- Made a call
- Signed up for newsletter
- Downloaded content (PDF, eBook, etc.)
It also shows you which pages were responsible for the most conversions, and how the conversions broke down by source of traffic (Google, Facebook, etc.).
3. What Pages Are Most Important to Your Site?
Another key feature of Google Analytics is being able to understand which pages on your site have the most value, in terms of traffic.
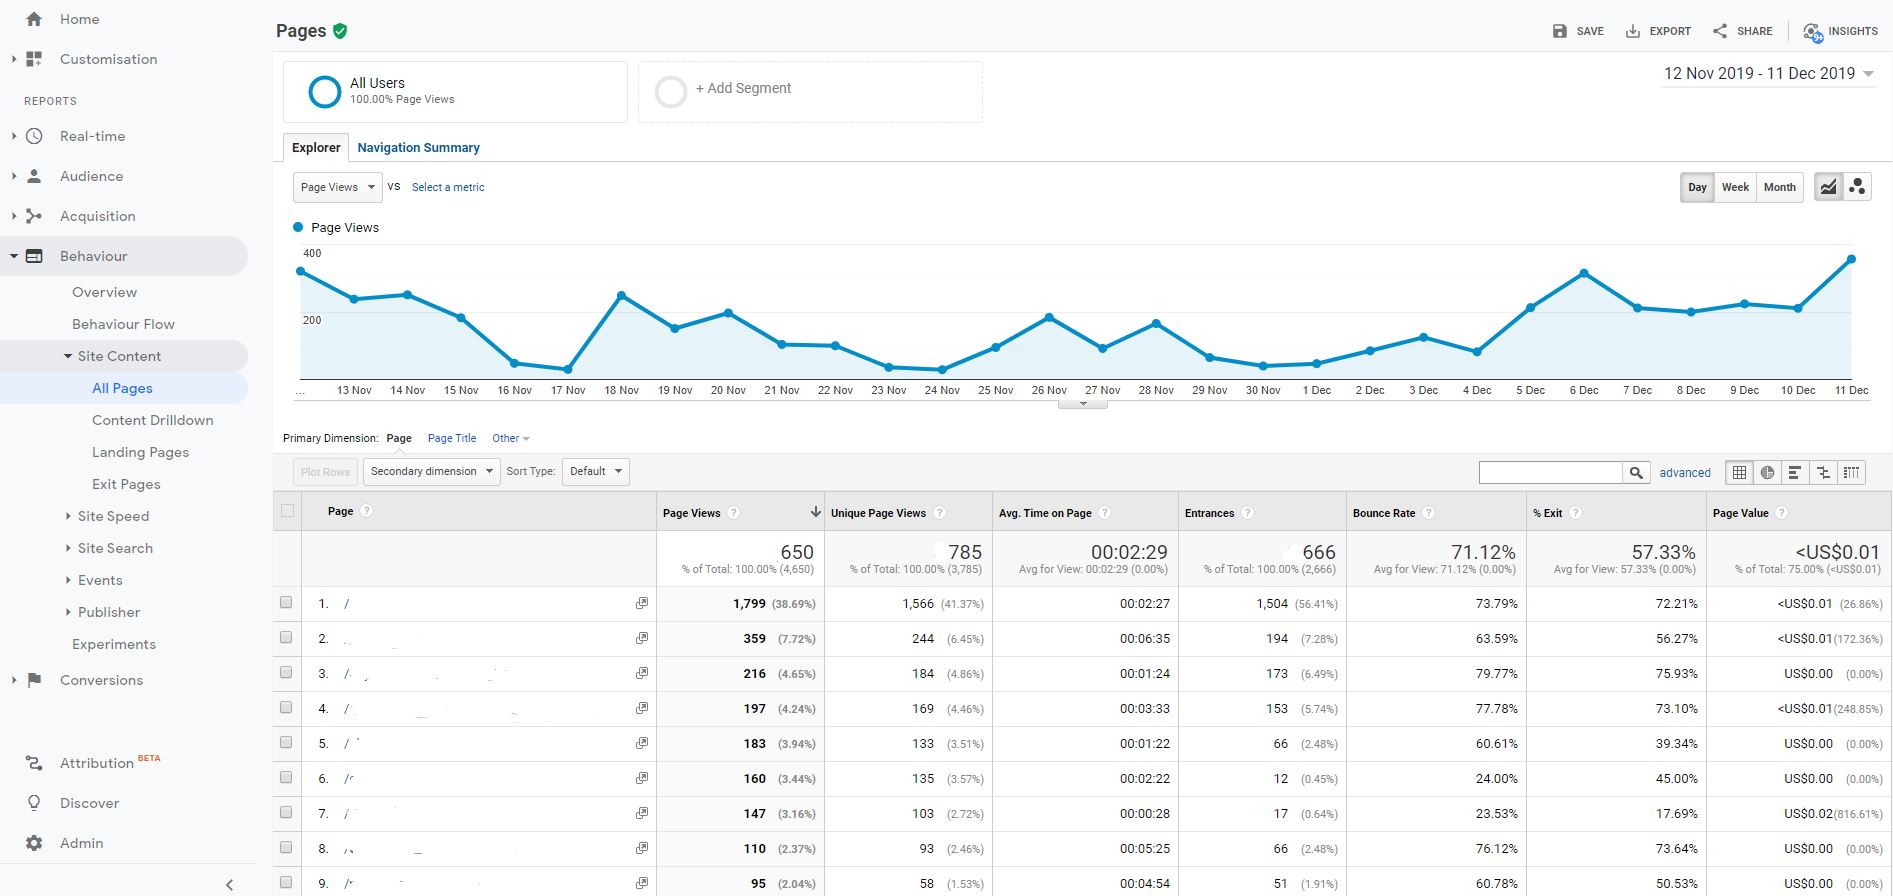
In the left-hand column, go to the “Behavior” section; select “Site Content” then open “All Pages.” (see screenshot above)
Here you’re able to see:
- which pages are spending time on (Unique Page Views & Average Time on Page)
- which pages are bringing in the most visitors (Entrances)
- which pages are people leaving from (% Exit)
You can expand the number of pages displayed on your screen by selecting the ‘Show Rows’ in the lower right-hand corner.
4. Who’s Using Your Site? Where? How?
Want to learn some specifics about your site visitors?
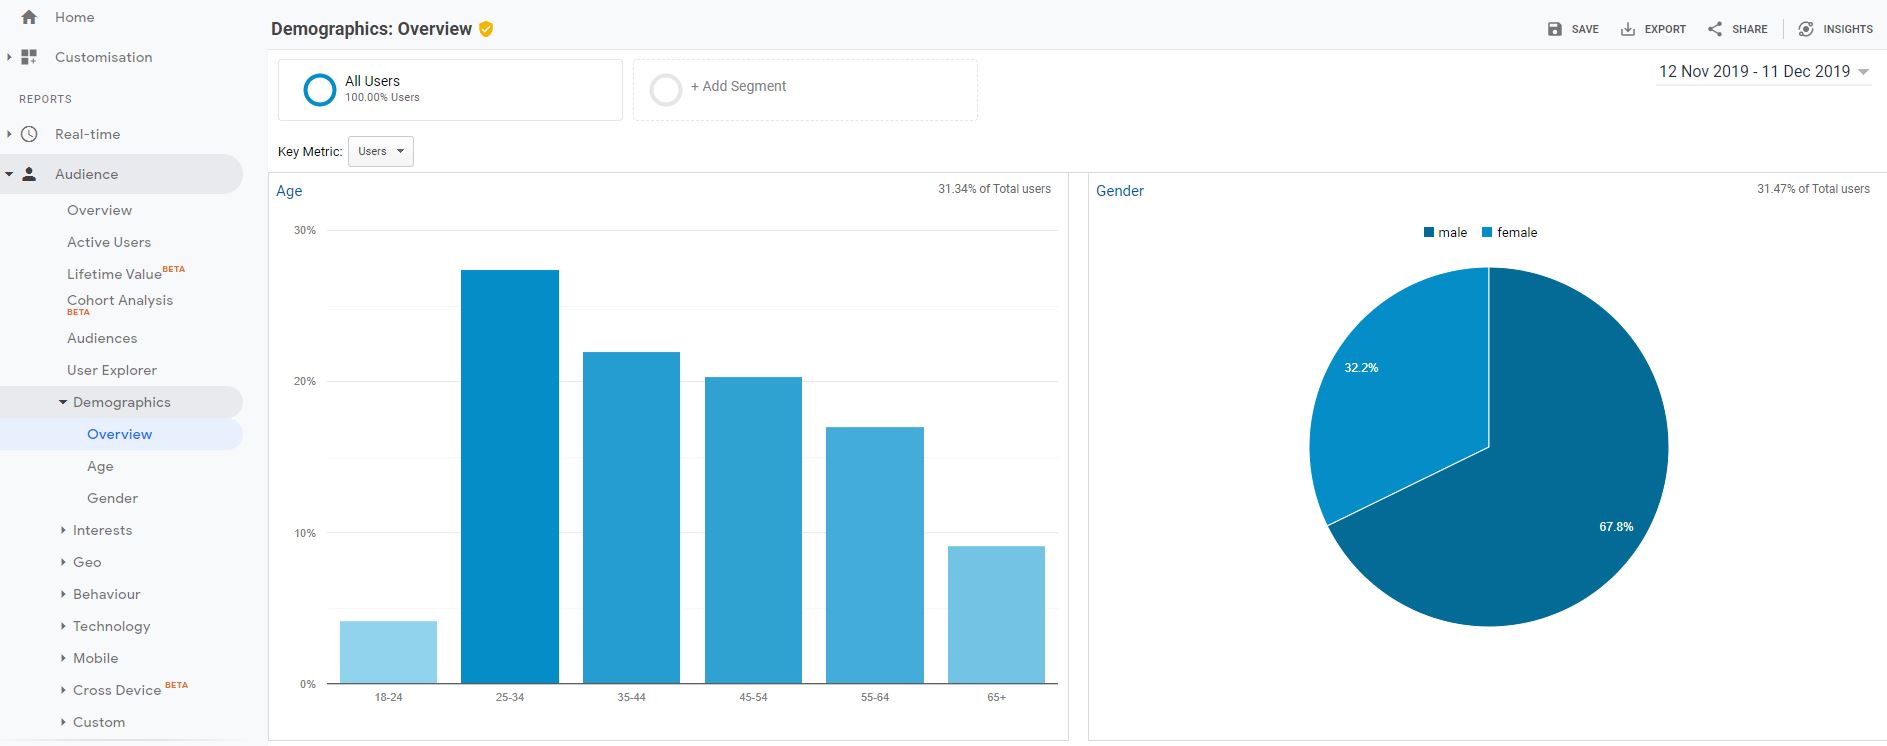
In the left-hand column, go to the “Audience” section. (screenshot above)
The Demographics overview will give you a breakdown of visitors by age and gender.
Other tabs in this category will tell you about where your visitors are located, what type of device they’re using, and other useful information that will help paint a clearer picture of who’s visiting your site.
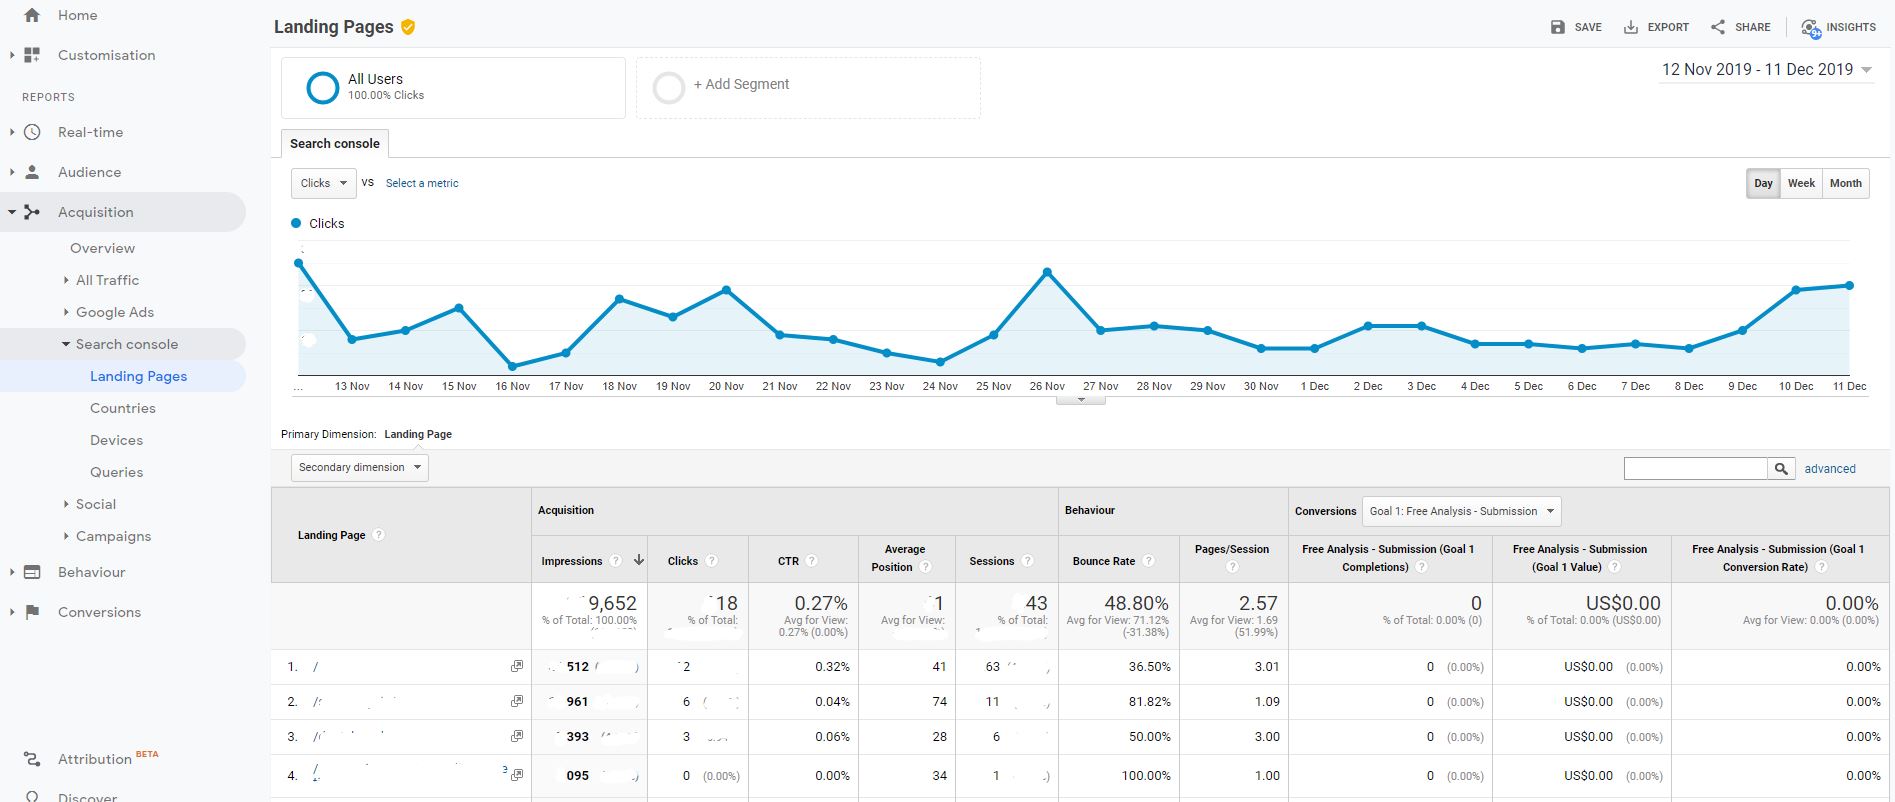
5. What Are People Searching for to Find You?
If you’ve got a decent amount of organic traffic, it’s useful to know which search queries people are typing in that lead them to your website.
Google has actually created a separate platform for Search Console. But you can also find this data within Analytics (above screenshot) by going to the Acquisition tab and opening Search Console and selecting Landing Pages from there.
Search Console gives us all the data of:
- What queries are causing your website to show up
- Which queries are ranked on average position in search results
- The click-through rates of each query (this tells us the percentage of times a page has appeared in a search versus the percentage of times they’re actually getting clicked)
That data can almost immediately tell us 5 simple things that you can do to improve your site’s SEO.
What Can You Expect from an Analysis?
This examination of your Google Analytics will give you the confidence to understand what’s happening on your website.
It will show you not only what you should be doing to better market yourself, but give you an actual understanding of the why behind it.
Many companies sell packages or push services.
Our approach is to meet with you, analyze and understand the data, then use it to tell us where the opportunities are. All that while knowing that we’ve got a fully qualified team to support you, showing you the best use of your money for the most optimal returns.
There are always opportunities to improve your website and market your business better.
The value in speaking to our team is that we pride ourselves in being able to key in on top 3, 4 or 5 things that will give you the most bang for the buck.
Rather than focusing on the wrong strategies, getting discouraged and giving up on something that could be a key differentiator in growing your business, you’re starting at the right spot and are encouraged with the results that good digital marketing can provide.
Feel free to get in touch with us. We’ll run a confidential analysis (read-only, no changes) of your Google Analytics, and we’ll let you know what’s working well and where the opportunities are for improvement.