


If you are visiting this blog, chances are you have just received a monthly marketing report with WebMarketers and are ready to keep the momentum going to the upcoming month. You have most likely just received your first marketing report and may have a few questions understanding what all these numbers, charts and graphics mean. You are also probably quite curious to analyze the progress of your website and how it has performed in the past month!
We have broken down each of the terms listed on your report to help you better understand the terminology that is often used in the marketing world as well as to allow you to better understand how your website is performing, where it is excelling and where there is room for improvements.
Part 1. Google Analytics
Introduction
This section of the report will take a deeper look into the overall statistics of your website visitors – Where did they came from? How long did they stay on your site? How did they interact with the site? We have outlined all of the terminology below that you will see on your report and provided you with a brief description that will allow you to quickly become a Google Analytics expert!
Part 1 Quick Links:
1. Sessions
2. Pages / Session
3. Avg. Session Duration
4. % of New Sessions
5. Bounce Rate
6. Goal Completions
7. Organic Search
8. Paid Search
9. Direct
10. Social
11. Referral
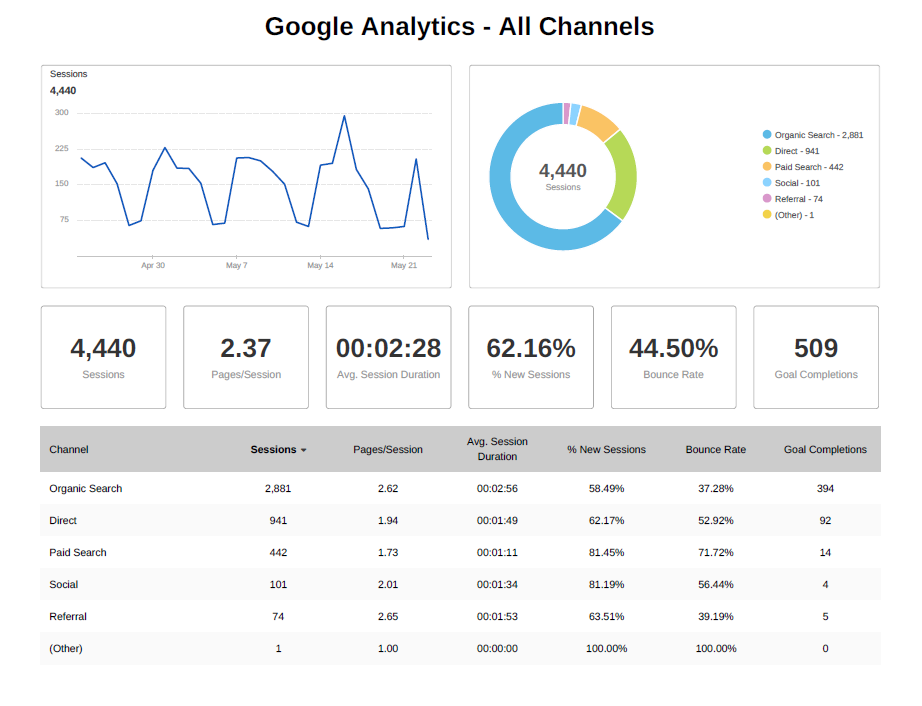
Sessions
A session is a single visit to your website by a user. A session consists of whenever one or more pages, are viewed on your site. To put it short and simply, a session means that someone has visited your website.
Pages/ Session
This metric lets you know on average how many pages does the user visit in their session on the website. You will want to find a happy medium with your pages/session results. If this is close to 1.00, chances are the average user did not care to search through your website to find what they were looking for. If this number is too high, it could potentially mean that your website’s user journey is not clear and they are lost on your site.
Avg. Session Duration
Provides a top-level view of how long the average users is spending on your website. For example, if you had two users, one that spent 6 minutes on your website and another that spent 2 minute, then you would have an average session duration of 4 minutes. Here is an interesting tidbit of information or you: Google does not count time for the last page viewed during a session. Therefore, this means that average session duration will be a bit lower than the true actual amount of time people are spending on your website.
% New Sessions
This percentage will give you an idea of how many sessions on your website were users that had never visited your website before. Curious to know how many visitors on your site were first time visitors? Multiply your total number of sessions by this percentage and you can find out!
Bounce Rate
Bounce rate is the percentage of users that came to your website, viewed only one page and then subsequently left your website. Bounce rate can provide top-level insights on how engaging your website’s content is and if the user is intrigued enough to click around. It’s important to apply context when analyzing bounce rate. Let say as an example your home page has a clear call to action with a contact form in the slider. The user could potentially visit your site and do exactly what you want them to do: visit the home page, read a little about your services and about the company, reach out on the contact form and then leave the site. This would be an excellent customer journey but would still be considered towards the Bounce Rate.
Goal Completions
When a user takes action by completing a particular goal during their visit on your site, they’ll be counted as a goal completion. You are probably asking, what is a goal? A goal is an action chosen by WebMarketers that relates to what we are hoping the user to accomplish on the site. The standard examples of goals are: contact form submissions, tap-to-email links and tap-to-call phone numbers on mobile. Goal Completions are always set by WebMarketers so pending on your company, you may have some additions goals being tracked. If you want to learn more about which goals are being tracked, feel free to ask Tyson and he will happily help you out!
Organic Traffic
Organic Traffic refers to people clicking on a free link from a Google search results page. For example, if you are a cabinet maker in New York and someone searches “Cabinet Makers in New York” and finds your website in the organic section (see screenshot) that will count towards your organic traffic.
Direct
Direct traffic includes people who typed your website’s URL directly into their browser. Another Here is an interesting tidbit of information for you: If for some reason Google Analytics is unable to determine the source of the visitor, they will consider the visitor as direct traffic.
Paid Search
Paid search refers to people clicking through to your website from a paid advertising campaign. As you all have seen before, when you make a search on Google, there is a section at the top and the bottom of the page specifically for paid advertising. Anyone that clicks on a link in this section and comes to your site, means that they will be accounted for under paid search
Referral
A referral is reported when a user clicks through to your website from another third-party website. As an example, if you own a restaurant and there is a third-party blog that includes your restaurants’ website link in their “Top 5 Restaurants in the City” blog. Anytime someone clicks on that link from their blog, they will be accounted for as a referral.
Social
Social traffic automatically includes traffic coming from any social media website, including Twitter, Facebook and Instagram. A visitor came to your website through that super adorable puppy Instagram post you posted last week? That would have been accounted for as social traffic.
Part 2. Google AdWords
Introduction
This section of the report will take a deeper look into your Google AdWords Campaign – How many people saw my ads? How many times did people click on my ads? How many leads did I get from my campaign? We have outlined all of the terminology below that you will see on your report and provided you with a brief description that will allow you to quickly become a PPC expert!
Part 2 Quick Links:
1. Clicks
2. Impressions
3. Cost
4. Average CPC
5. Conversions
6. Cost per Conversion
7. Conversion Rate
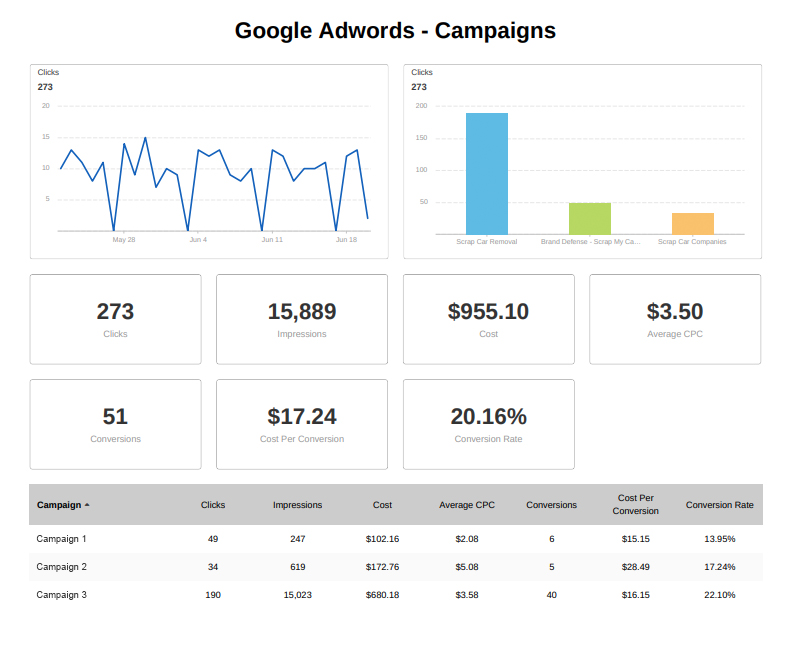
Clicks
Any time your Google Ad is clicked and the user is sent to your website, Google registers that as a “Click”. You will often hear a Google AdWords Campaign be called a PPC campaign. PPC stands for pay-per-click as that is essentially how your AdWords campaign works.
Impressions
When ever your ad has been shown on to someone through Google’s Search and Display networks, it is considered an impression. As an example, if you are running a Google AdWords campaign to find new leads, any time someone sees your ads while searching for keywords related to your campaign, regardless if they click your ad or not, it is counted for as an impression.
Cost
This might be the most straight forward metric of them all, plain and simply this is the total amount spent towards getting you new visitors to your website.
Average CPC
Average CPC stands for average cost per click. When ever you are running an AdWords campaign, chances are you are competing against others for certain popular search terms. To keep things simple, the more competition for a search term, the higher your cost per click will be. Are you curious to learn more about how Google determines their bid price for each click? Here is a great article that explains it in more detail.
Conversions
When a user clicks on one of your Google ads and then completes one of your predetermined goals (see above for what a goal completion is) it is tracked as a conversion. If a goal is completed multiple times during a user’s session, it will only be counted as a single conversion. For almost all cases, a conversion is synonymous with a new lead.
Cost Per Conversion
This is exactly what it reads, it is the cost it took to bring in a new conversion. This can be simply determined by taking your total amount of ad spend and dividing it by the number of conversions.
Conversion Rate
Your conversion rate is the percentage of user that visited your website from a Google AdWords Campaign who then took action and completed one of your set goals. This can be simply determined by taking your total number of clicks and dividing it by the amount of conversions. The average conversion rate for a website across all industries is 2.35%, if your website’s conversion rate is above 5.31% you are now in the top 25% of websites!
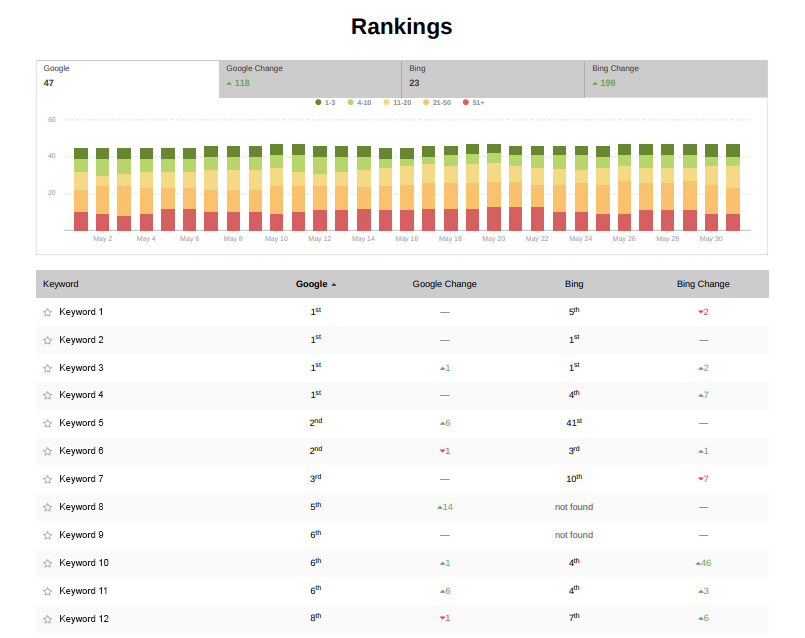
Part 3. Rankings
Frequently Asked Questions
I don’t see a certain keyword on this report, does that mean I am not ranked by google on that keyword?
Not at all! The keywords on this report do not reflect every single search term that your website is being ranked for. The keywords in this section of the report are ones that were chosen by WebMarketers that will properly reflect potential search terms that would be valuable for your company.
I don’t see a keyword on the report that I am curious to know how I rank for. What can I do?
If there is a popular keyword that you think should be tracked or are curious to know where you rank for, simply let Tyson know and he would be happy to add it to your report for the upcoming month. That being said, it is important to keep this tracked keywords lean and concise to ensure that we are not dwelling on search terms that are often hardly searched or don’t relate well to your services.
Why is there always fluctuation in my rankings each month?
Google will change the way it is ranking websites in a much different method than you probably could have anticipated. Google will often play around with the rankings, for example, it may take a site that is ranked 20th and bump it up to 10th for a few days, Google will analyze how the site performed at that ranking by looking at how users interacted with the website. If Google believes that its users that visited this site found what they were looking for, it will give them an added boost and permanently rank them higher than before. If Google does not like what it sees looking at the user’s journey, for example they left the page within 10 seconds, it will know that this page may not quite fit this search term and will bump it down. Overall a successfully improving website’s rankings will appear very similar to that of a successful stock market. It will have slight ups and downs but will be trending upwards!
I see I am being ranked by Bing on my report, do people still actually use Bing?
Believe it or not, there are still those out there that use Bing instead of Google. It always comes down to your company and what services you are offering but for the most of you, Google will be the search engine that will give you the most visitors. We still include Bing search metrics in the report as we want to provide you with the most information about your company’s website as we can.
Part 4. Conclusion
We hope this was able to answer any questions you had about your report. As always if you still have some questions that this blog was unable to answer, by all means, send Tyson an email and he would be happy to review your report with you and answer any more questions you may have. At WebMarketers, our goal is to help you best understand how digital marketing works so that you can truly see how we are able to create an unfair advantage for your company!